Елена Николаевна Пояркова
ЕГЭ по английскому языку 2022 (задние 40.2). Полный курс по подготовке к письменному заданию нового формата
От авторов
Пособие содержит материал для подготовки к письменным заданиям ЕГЭ (40.1 / 40.2) по английскому языку согласно демоверсии ФИПИ на 2022 год.
Мы очень надеемся, что сборник будет полезен учителям при подготовке учеников к ЕГЭ по английскому языку.
С уважением, авторы
Пояркова Е. Н.
Калинина О. В.
Ваши вопросы, пожелания и замечания отправляйте по адресу helen5442@yandex.ru
Также можно связаться с авторами в Instagram:
Пояркова Е. Н. @helenefremova
Калинина О. В. @easyy__english
Эта книга предназначена для персонального использования и без разрешения авторов не может быть передана третьим лицам в соответствии с ГК РФ ст. 1229 п. 1.
Воспроизведение или распространение указанных материалов в любой форме может производиться только с письменного разрешения правообладателя. При использовании ссылка на правообладателя и источник заимствования обязательна.
Все права принадлежат авторам, копирование, в том числе отрывков, распространение и использование в коммерческих целях запрещены.
Содержание
Вводная информация
Описание графика…………………………………………………………..2
Анализ Данных………………………………………………………………4
Информация для сравнения………………………………………………6
Заключение…………………………………………………………………..7
Практические задания
Задание 1……………………………………………………………………..8
Задание 2……………………………………………………………………11
Задание 3……………………………………………………………………15
Задание 4……………………………………………………………………17
Задание 5……………………………………………………………………20
Задание 6……………………………………………………………………22
Задание 7……………………………………………………………………24
Тренировочные варианты
Задание 1……………………………………………………………………27
Задание 2……………………………………………………………………28
Задание 3……………………………………………………………………29
Задание 4……………………………………………………………………30
Задание 5……………………………………………………………………31
Задание 6……………………………………………………………………32
Задание 7……………………………………………………………………33
Ответы……………………………………………………………………….34
Describing graphs vocabulary
●
Illustrate
The table illustrates that…
●
Reveal
(information)
The table reveals that…
●
Provide
(information/ differences )
The bar graph provides the differences between…
●
Present
The graph presents the information about…
●
Show
The graph clearly shows that… / The presented chart shows information about…
●
Indicate
As the chart indicates…
●
Depict
The provided diagram depicts…
●
According to..
.
According to the chart…
Complete the sentences.
1. The graph chart d__________ the differences about popular literature genres.
2. A__________ to the chart, fiction books are the most popular among readers.
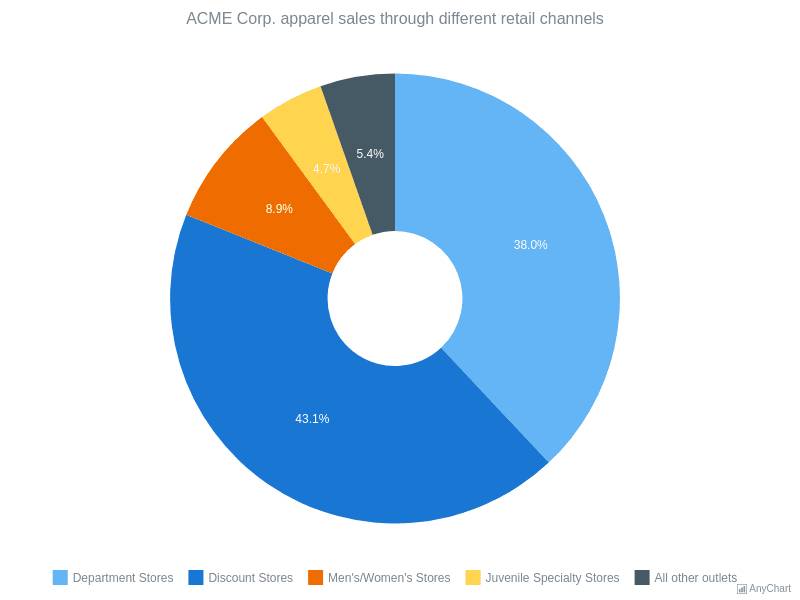
3. The pie chart i__________ that people tend to use their computers for work more often.
4. The presented chart p__________ the information about the popularity of different car brands.
5. The graph s__________ i__________ about various types of magazines.
6. The chart r__________ two main features…
7. The table p__________ the contrast between popular computer games.
8. The bar chart c__________ sh__________ that the most popular game among teenagers is “X”.
Use given words to label the pictures.
chart bar chart pie chart graph table

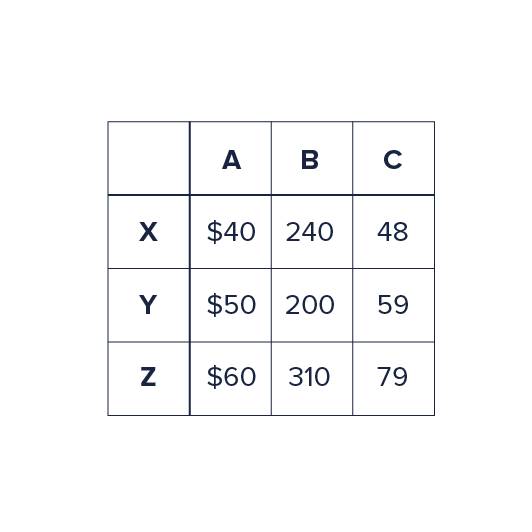
______________________________ 2. ______________________________
3. ______________________________ 4. ______________________________
Which word can be used to describe any of the pictures given?
5. ______________________________
Analyzing the data
●
As a general trend, …
As a general trend, horror films appear to be the most popular among teenagers.
●
As can be seen, …
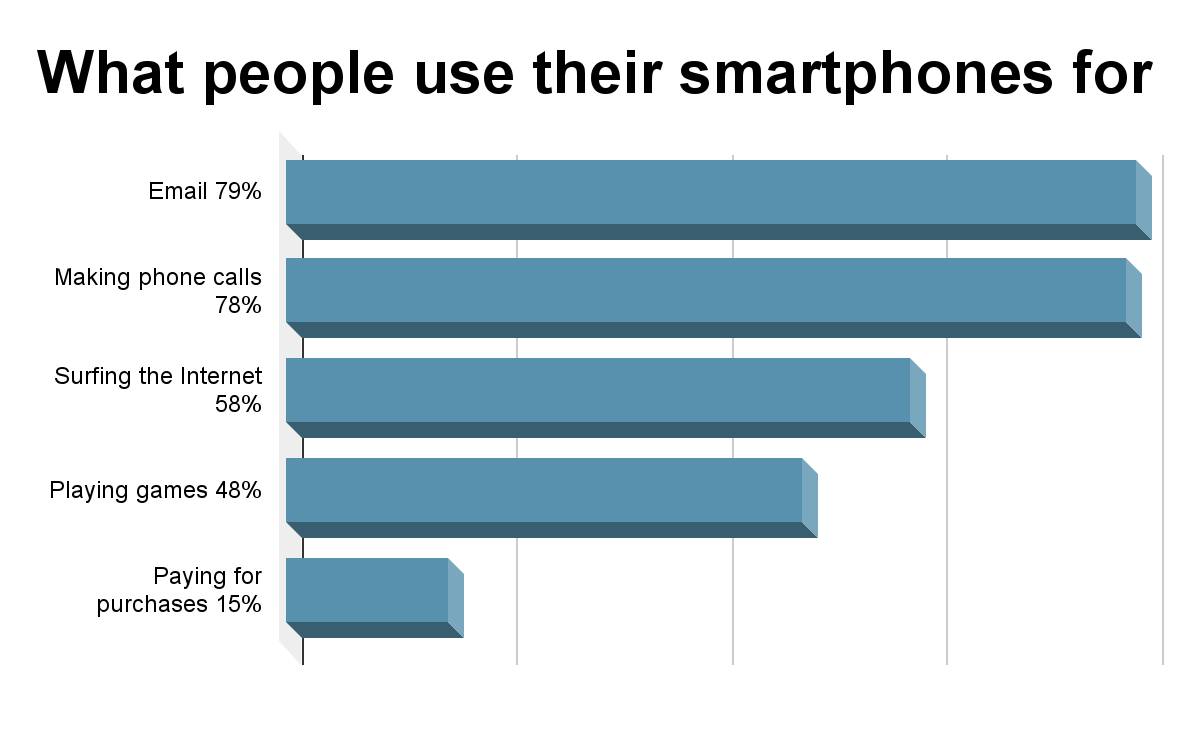
As can be seen, paying for purchases is the least common aim of smartphone usage.
●
As an overall trend, …
As an overall trend, loyal users of mobile phones seem to be growing.
●
At first glance,…
At first glance, the work appears difficult.
●
…as is presented…
Teens tend to read fiction books more, as is presented in the bar chart.
Paraphrase the sentences, using the phrases above:
Teenagers watch American sitcoms all the time.
The bar chart shows that kids like playing hide-and-seek the most.
The pie chart shows that readers prefer detective stories to other books.
At first, it is obvious that not many tourists go to Ireland in summer.
The most popular phone brand among teenagers is Apple.
2. Choose the best opening statement.
The bar chart shows the popularity of different home activities among teenagers.
Nowadays the rising generation chooses variable activities to spend their free time. The range of these interests depends on personal preferences, modern technologies, and popularity. I have found some useful data on the issue of popular home activities in Zetland to help me with the project on popular home activities among young people.
Teenagers choose different home activities when they are at home. Many home activities are popular among teenagers, which are shown on the chart.
2. The bar chart shows what people use their smartphones for.
Smartphones are taking up too much of our time these days, but if people want to reduce their screen time, they have to understand the reason they need them so much. I have found some useful data on the issue of what people use their smartphones for in Zetland to help me with the project on the subject.
Making phone calls is more important for people than playing games on smartphones, which is interesting because real calls are becoming less and less popular.
3. The table reveals some information about what book genres are popular among teenagers.
Books can be helpful for your study and you can use them to read in your free time, but isn't it interesting to know, what types of books are more popular?
Reading is one of the most popular hobbies among different people. Surprisingly, teenagers living in a century of modern technologies are still interested in reading today. I have found some interesting statistics on genres young people prefer to read to help me with the project on the subject.
Comparing information
General trends
Comparison
… by far the most popular item/product / language …
… much more popular than…
… the least popular product was …
… not as popular as …
…the highest percentage of….
… as popular as ...
…the lowest proportion of…
In contrast,…
By comparison,…
Extra vocabulary:
➢
2% = a very small proportion of
➢
20% = a fifth
➢
24% = almost a quarter
➢
25% = a quarter
➢
32% = nearly one-third
➢
35% = more than a third
➢
49% = just under a half
➢
50% = a half
➢
51% = just over a half
➢
55% = more than a half
➢
70% = a large proportion of
➢
72% = a significant majority of
➢
…approximately…
➢
…nearly…
➢
…roughly…
➢
…almost…
➢
…just over…
➢
…just under…
➢
…just around…
➢
…just about…
➢
…just below…
➢
…a little more than…
➢
…a little less than…
Examples:
For example, …
For instance, …
A very good example is …
Conclusion
Conclusion
Opinion
Finally…
In my opinion,…
In conclusion….
To my mind,…
To sum up…
Personally, I believe....
In summary, ….
It seems to me that…
Therefore,....
I am convinced that….
Use the words from the table to complete sentences:
Many people say that smartphones can harm our eyes. P__________, ___ b___________ that we should reduce the screen time.
I__ c________ we see that Greece is one of the most popular tourists` destinations.
About 50% of citizens own two or more cars. T___________, they pay more taxes than the others.
Despite the common opinion, i__ s______ t__ m__ that milk isn`t healthy.
F__________, it is clear that rock music does not interest as many people as pop songs do.
I__ s____________, we need to take better care of the poor in our city.
How would you s____ u___ his writing?
*
2. What do you think about pop music?
In my opinion,
Practical tasks
Analyse the diagram data and decide, whether the statements are true or false:
Most smartphone users need their electronic devices for sending emails and making phone calls, 79% and 78%, respectively. T / F